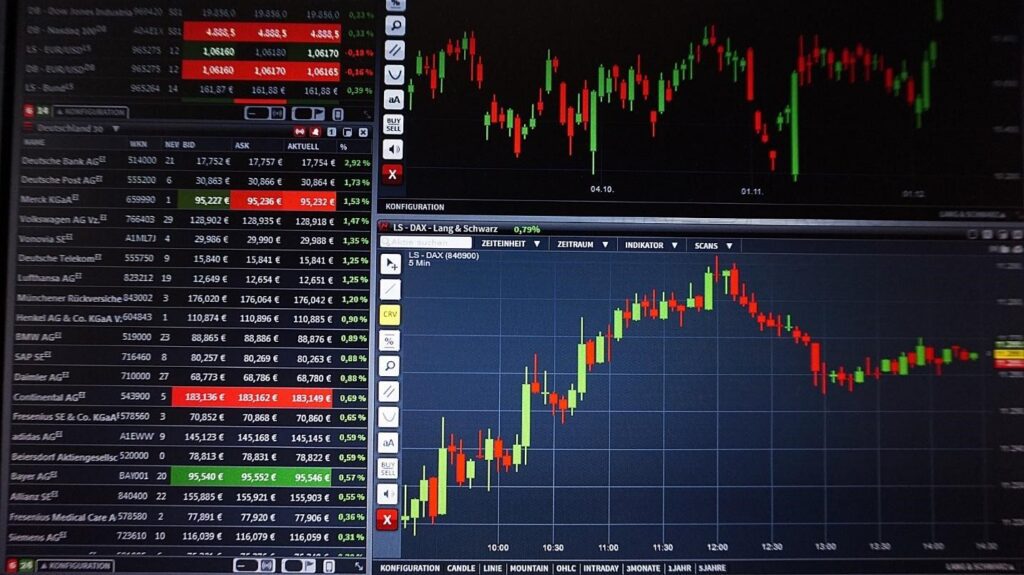
A currency exchange chart graphically shows the behavior of currency pairs. Day traders and technical analysts look at the charts to identify patterns and strengths that signal continuations, reversals, exits, and entry points. Most traders utilize forex charting software packages to establish the likely direction of a currency pair. They also use other technologies, such as predictive forecasting software, to get the upper hand in the forex markets.
A chart will allow a trader to view the past, which can be a predictor of the future. Most forex brokers will provide free charting software for those who open and fund a trading account.
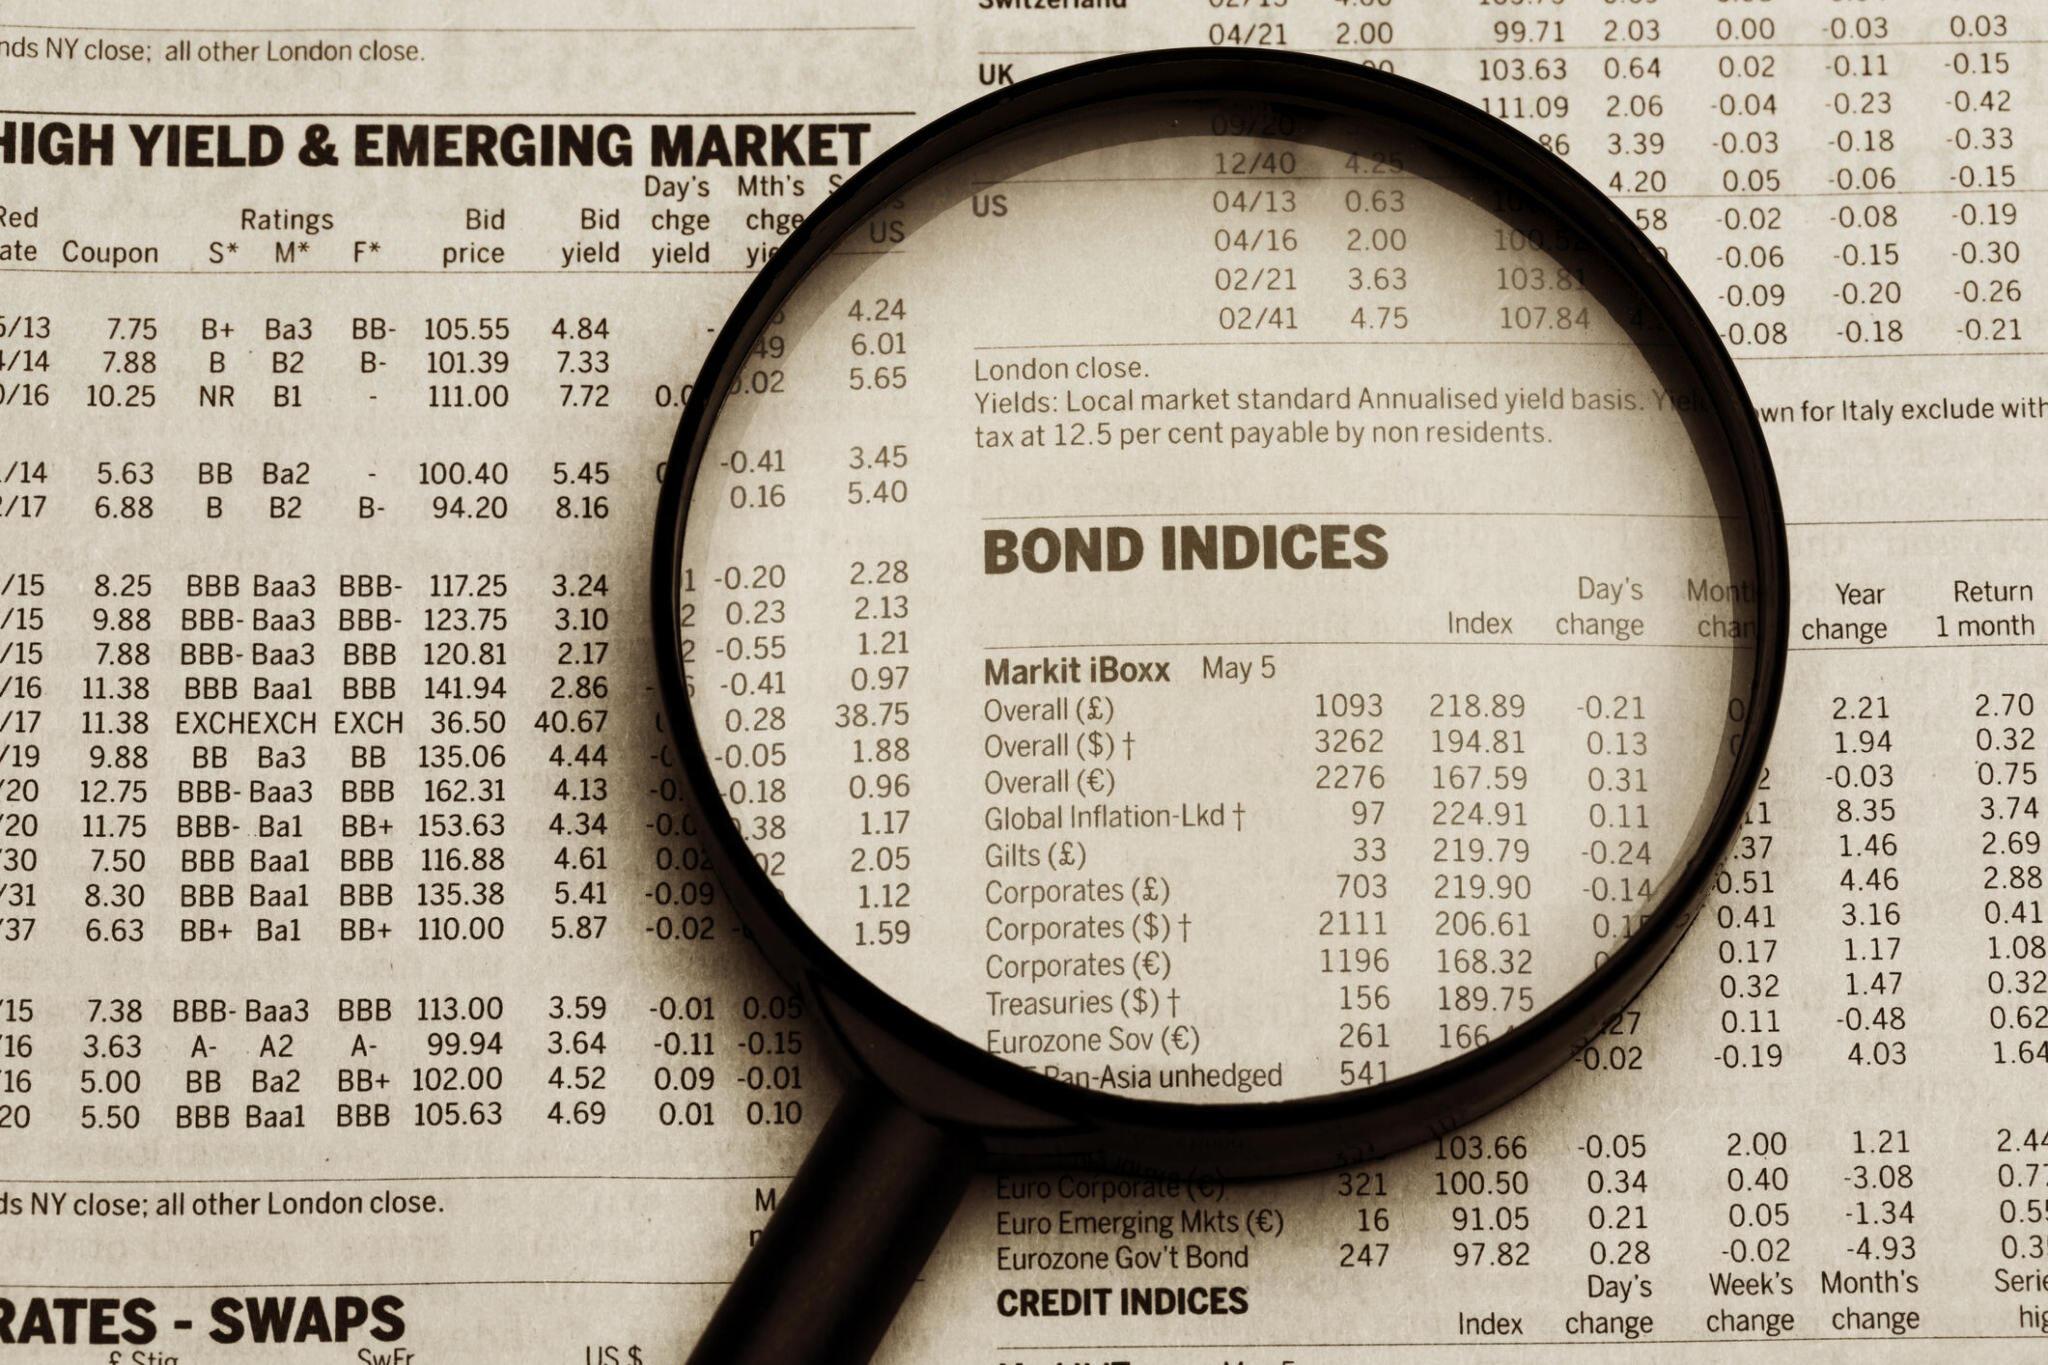
Charts are vital for traders who wish to incorporate technical analysis to determine where to invest their funds since they can reveal trends. They can be overwhelming to new investors and traders. This article outlines five key principles to assist you in understanding how to interpret currency exchange charts effectively.

1. Identifying Trends
One of the most crucial aspects of currency exchange charts is identifying trends. They can provide crucial information about the market direction and potential investment opportunities. Say, by identifying a trend in the USD CAD chart, you will determine whether to expect a bearish or bullish trend and the outlook for the year.
A bullish trend indicates a market moving upwards, while bearish trends indicate a market moving downwards. On the other hand, a flat trend will indicate a market not experiencing much movement in any direction. By identifying these trends, investors and traders will make informed decisions about their investments.
2. Understanding Technical Indicators
Technical indicators assist investors and traders in interpreting market movements and trends. They provide valuable insights into market conditions and assist traders and investors in identifying potential exit and entry points. There are different types of indicators, with the most common being Oscillators, Moving Averages, Volatility, and Price Bands.
Most new traders need to constantly switch between indicators. Yet, there is no easy route that can lead to big profits. It is always best to understand tools before you use them for the best results. Each indicator has its unique characteristics and data points informing it. Therefore, you should develop a strong familiarity with each indicator before encompassing it into your trading strategy.
3. Know Which Chart to Choose
There are different kinds of charts you can use. The three most popular carts are line, bar, and candlestick charts. Each chart has its unique characteristics, advantages, and disadvantages.
A line chart draws a line from one closing price to the next. It is simple to follow but only provides a trader with little information about price behavior within a certain period. This chart is typically used to get a bigger-picture view of price movements. It also shows trends the best in the simplified slope of the line.
A bar chart is more of a bar and less of a chart. It is a little more complex than the line chart and shows opening and closing prices and lows and highs. With a bar chart, you will see the price range of each period. The bars may increase or decrease from one bar to the next or a range of bars.
The candlestick chart is a bar chart variation. They show the same price information as a bar chart but with prettier graphic format. Most traders use this chart because it is much prettier and easier. They help visualize bearish or bullish sentiments by using different colors.
It is worth noting that there are different chart types, and one is not necessarily better than the other. The way data is presented and interpreted varies despite the data being the same. You can choose any type or use multiple chart types for technical analysis.

4. Understanding Resistance and Support Levels
Resistance and support levels are crucial concepts in currency exchange chart analysis. Resistance levels are price levels where the market encounters resistance, while support levels are where the market finds support and rebounds higher.
The resistance and support levels are important to traders because they provide potential exit and entry points. If the market is approaching a support level, buying is advisable. On the other hand, it would be best to sell if it is approaching a resistance level.
5. Simplicity Is Key to Success
It would be best to do things with simplicity and consistency as a trader. Also, it will help if you focus on key levels, price bars, and price action to understand the market’s tone. Any indicator that will help you do all these is good, while anything that distracts you should be shunned.

Wrapping Up
Charts are a valuable tool for investors and traders looking to make informed decisions about their investments. You will increase your chances of success in the currency market by identifying trends using charts.
Remember, there is no right or wrong way of doing things when it comes to chart reading. Also, ensure you research and consult a financial advisor before making any investment decisions.